
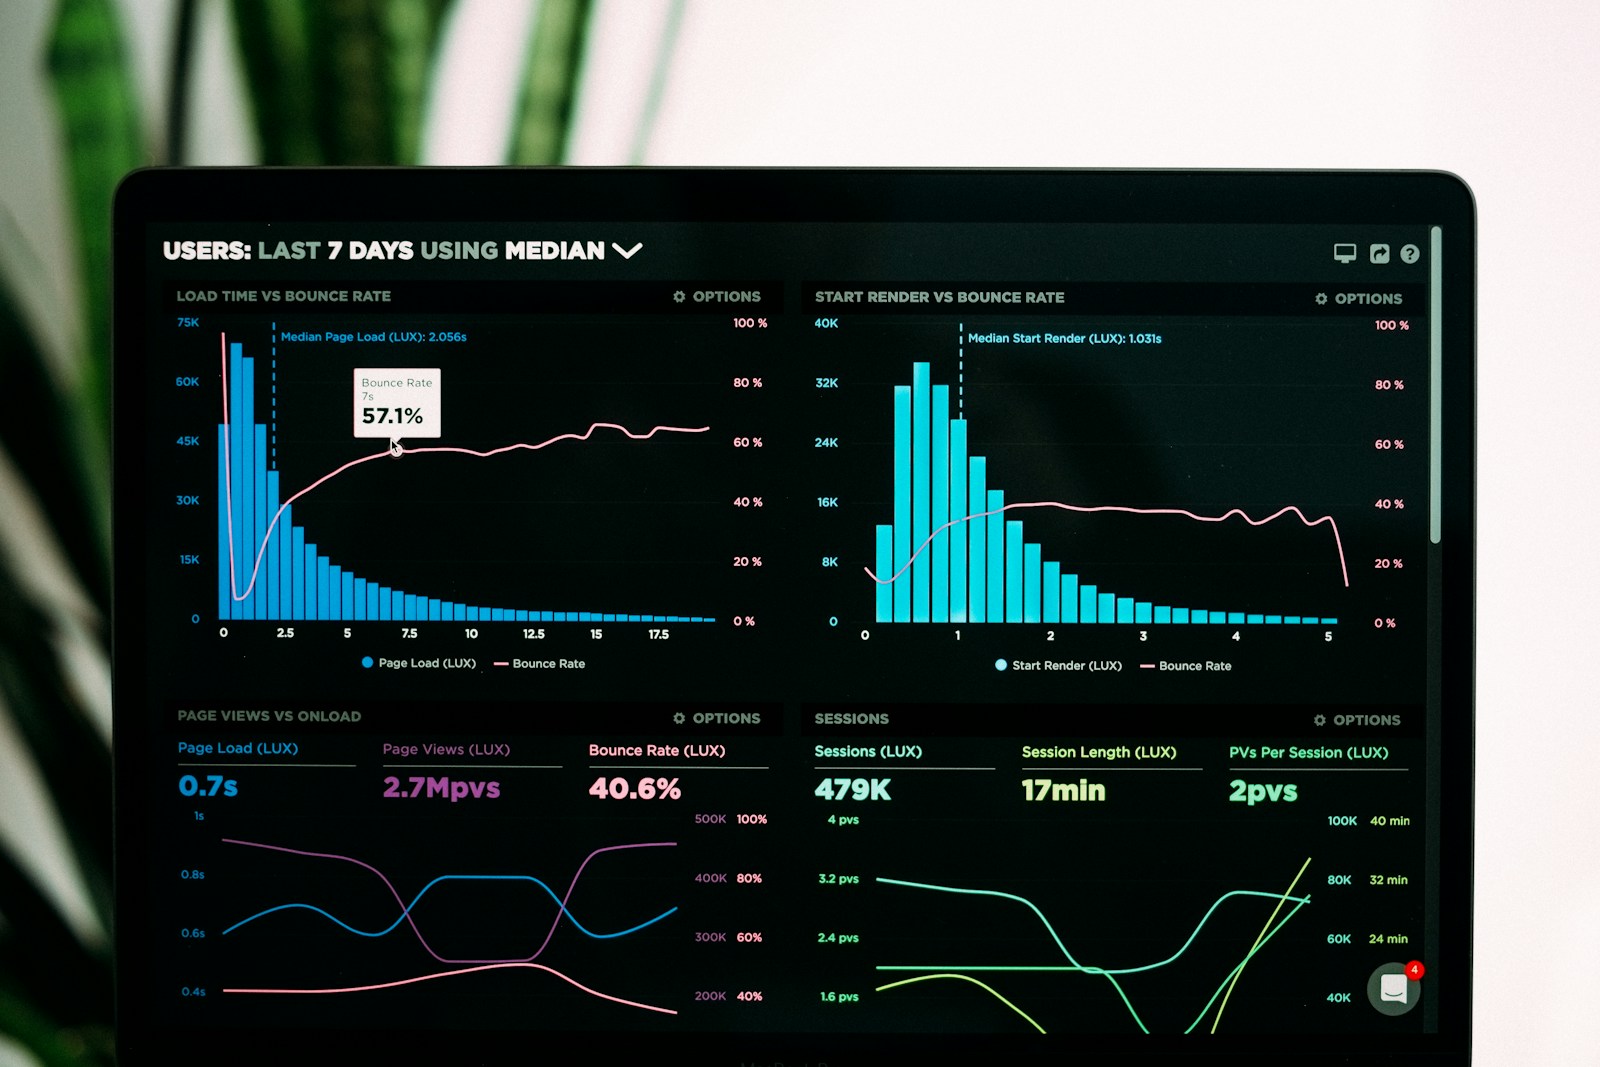
Dashboards fail when they decorate data instead of driving action. Real-time BI is valuable only when the right people see trustworthy signals in time to intervene—whether in fulfillment, support, sales operations, or infrastructure health.
From Raw Events to Decisions
- Collect: Capture operational events from apps, warehouses, and services.
- Model: Define metrics with clear owners and calculation logic.
- Visualize: Present trends, thresholds, and exceptions—not vanity charts.
- Act: Connect insights to workflows, alerts, and accountable owners.
Design Principles for Operator Dashboards
- Lead with exceptions and KPIs that change decisions today
- Keep definitions consistent across teams to avoid metric debates
- Use latency appropriate to the use case—seconds for ops, hours for strategy
- Provide drill-downs so teams can move from symptom to cause
Common Failure Modes
Too many charts, unclear ownership, delayed pipelines marketed as “real time,” and dashboards disconnected from operational tools. Fix these before adding more widgets.
Related capability: Explore WebHouse Inc. AI, Data & Intelligent Systems services, or talk to our team about your next build.
Strategic Conclusion
Great BI dashboards are decision systems. When metrics are trusted and actionable, organizations stop reacting late and start operating with timing advantage.